Gold Price Forecast: XAUUSD eyes $1,736 and $1,730 as next downside targets – Confluence Detector
- Gold price is extending its bearish streak at the start of the week.
- Hawkish Federal Reserve commentary and China’s covid woes boost the US Dollar.
- Gold price looks vulnerable following a weekly close below the $1,750 level.
Gold price is testing weekly lows below $1,750, in a negative start to the week. The bright metal is extending its losing streak into a fourth straight trading day this Monday, as the US Dollar continues its recovery momentum, drawing the latest support from broad risk-aversion. Investors remain wary amid China’s covid restrictions and hawkish Fed outlook on the terminal rates. Two covid deaths reported in Beijing combined with a five-day lockdown in Guanzhou has once again spooked markets. Meanwhile, Atlanta Federal Reserve President Raphael Bostic said on Saturday that he feels the Fed's target policy rate needs to rise no more than another percentage point to tackle inflation. Looking ahead, markets await the Federal Reserve November meeting minutes for fresh hints on the central bank’s policy outlook.
Also read: Gold, Chart of the Week: XAUUSD bears are moving in, focus is on $1,750, then $1,720
Gold Price: Key levels to watch
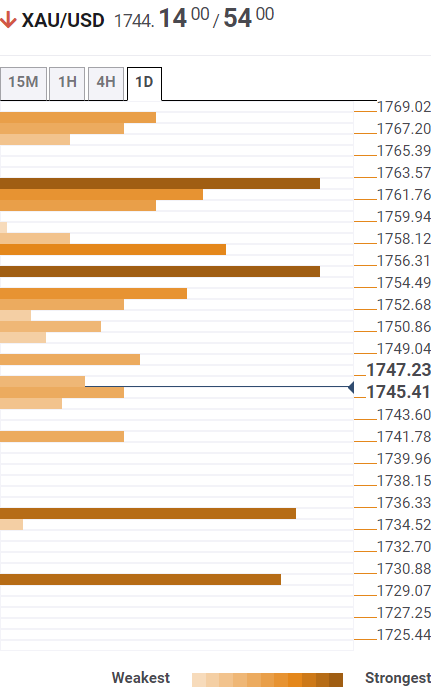
The Technical Confluence Detector shows that the gold price is flirting with the SMA10 one-day at $1,745 following a weekly close below the $1,750 psychological barrier.
A breach of the pivot point one-day S1 at $1,742 is likely to open floors for a test of the $1,736 demand area. That zone is the convergence of the pivot point one-day S2 and the pivot point one-week S1.
The last line of defense for gold buyers is seen at $1,730, which is the previous month’s high.
On the flip side, the immediate resistance is aligned at the previous day’s low of $1,748, above which the $1,750 level will be retested.
Acceptance above the latter will threaten the Fibonacci 23.6% one-day resistance at $1,753.
Gold bulls need to take out the powerful resistance at around $1,755, which is the confluence of the Fibonacci 38.2% one-day and SMA50 four-hour.
Here is how it looks on the tool
About Technical Confluences Detector
The TCD (Technical Confluences Detector) is a tool to locate and point out those price levels where there is a congestion of indicators, moving averages, Fibonacci levels, Pivot Points, etc. If you are a short-term trader, you will find entry points for counter-trend strategies and hunt a few points at a time. If you are a medium-to-long-term trader, this tool will allow you to know in advance the price levels where a medium-to-long-term trend may stop and rest, where to unwind positions, or where to increase your position size.