Back
11 Jul 2018
DXY Technical Analysis: current up move needs to reclaim 95.00 in order to allow extra gains.
- DXY extends the rebound well beyond the 94.00 milestone after finding dip-buyers in the 93.75/70 band, or Monday low, area coincident with the top of the cloud.
- The index quickly left behind the Fibo retracement of the April-June climb just above 9400 the figure and tested the boundaries of the relevant hourly high at 94.50 during Tuesday’s session.
- Further gains should emerge if the buck manages to clear the 10-day SMA and the 21-day SMA, at 94.41 and 94.64, respectively. For the up move to gain sustainability, the greenback should also clear the critical 95.00 handle.
- Daily RSI (14) stays around 51 at the time of writing, allowing for further upside.
DXY hourly chart
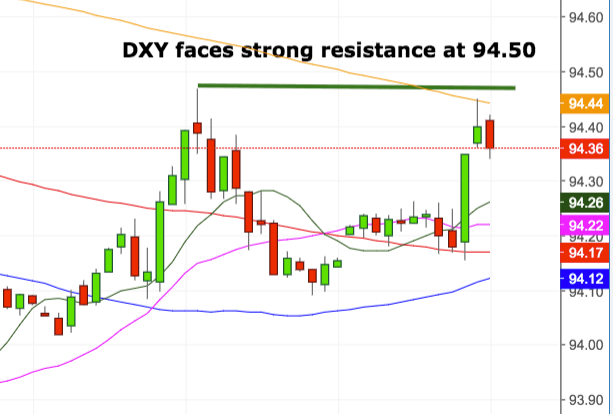
Daily high: 94.46
Daily low: 94.11
Support Levels
S1: 94.04 Fibo retracement
S2: 93.92 top of the cloud
S3: 93.84 55-day SMA
Resistance Levels
R1: 94.64 21-day SMA
R2: 95.03 high May 29
R3: 95.53 2018 high June 28