Back
14 Sep 2018
USD/JPY Technical Analysis: One step away from a breakout above 112.17 swing high
- USD/JPY bulls are eager to resume the main bull trend.
- USD/JPY is challenging the 112.17 resistance ( August 1, swing high). A sustained breakout above the level would open the gates to 112.50 figure and the 2018 high at 113.18. The RSI, MACD and Stochastics are supportive for higher prices.
- However, a failure above 112.17 or a bear breakout below 111.84 (August 29 swing high) would invalidate the bullish bias
USD/JPY 4-hour chart
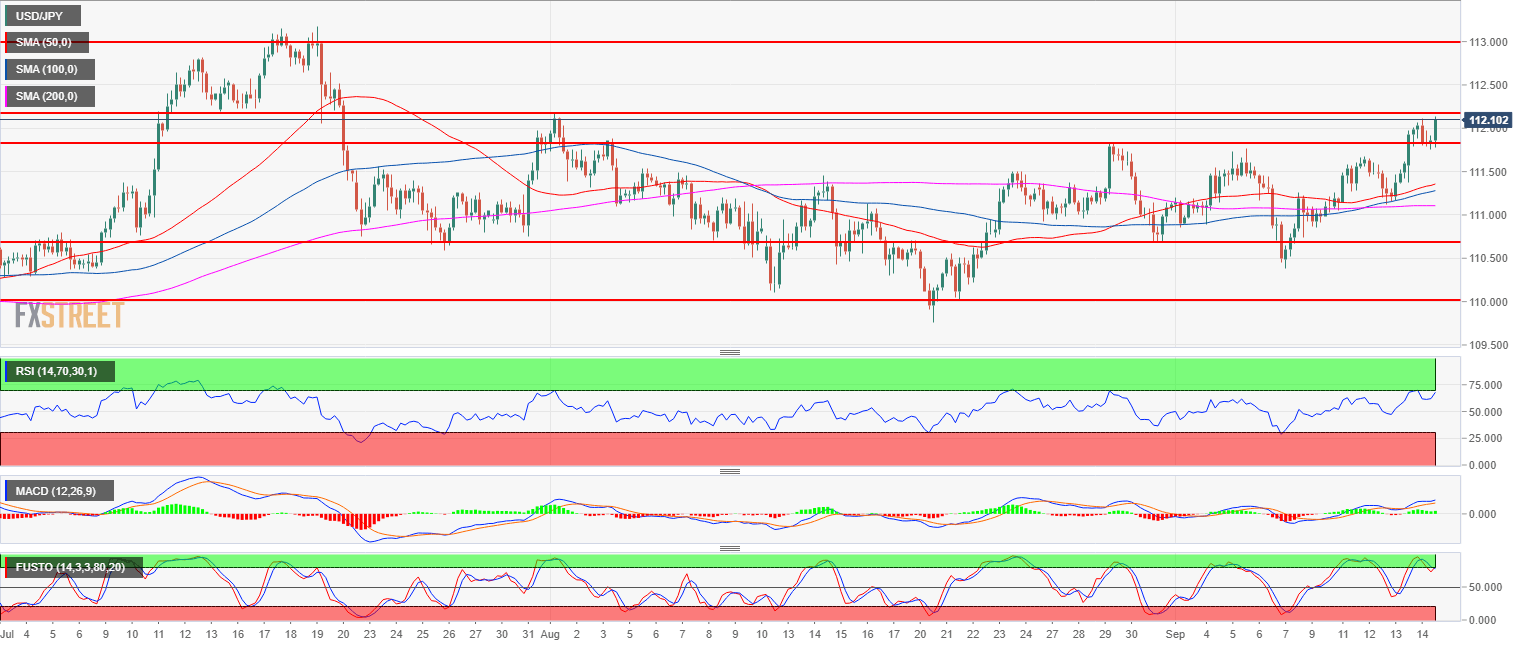
Spot rate: 112.11
Relative change: 0.17%
High: 112.14
Low: 111.75
Main trend: Bullish
Short-term trend: Neutral bellow 112.17
Resistance 1: 111.84 August 29 swing high
Resistance 2: 112.00-112.17 zone, figure and August 1, swing high
Resistance 3: 112.50 figure
Resistance 4: 113.18, 2018 high
Support 1: 111.84 August 29 swing high
Support 2: 111.54 August 6, high
Support 3: 111.45 August 8 high
Support 4: 111.00 figure
Support 5: 110.75, July 23 swing low
Support 6: 110.00 figure
Support 7: 109.37 June 25 low