Back
21 Mar 2019
USD/JPY Technical Analysis: Bullish turnaround en route towards 111.00 handle
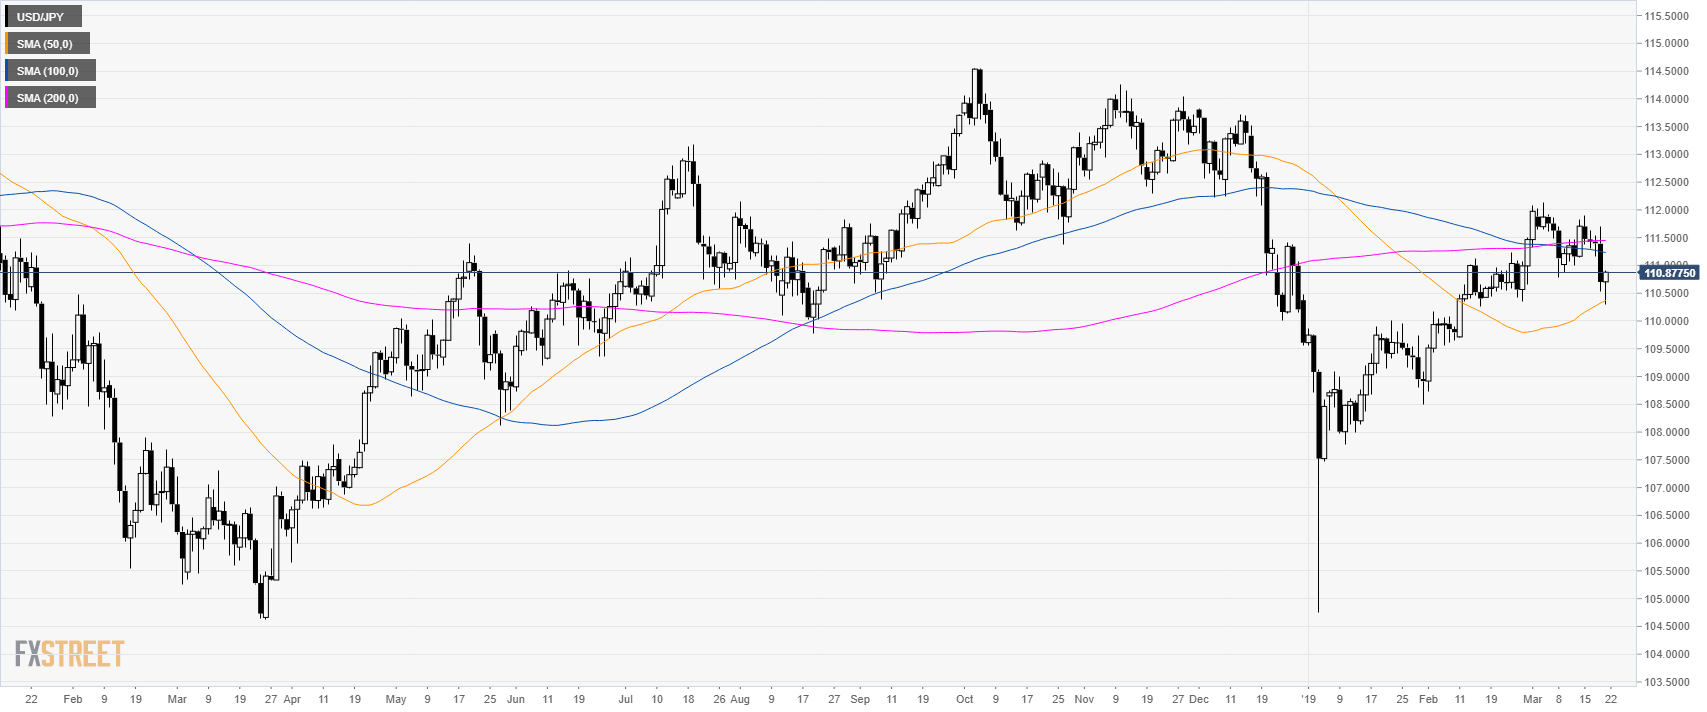
USD/JPY daily chart
- USD/JPY is trading in a sideways trend between the 50 and 200-day simple moving averages (SMAs).
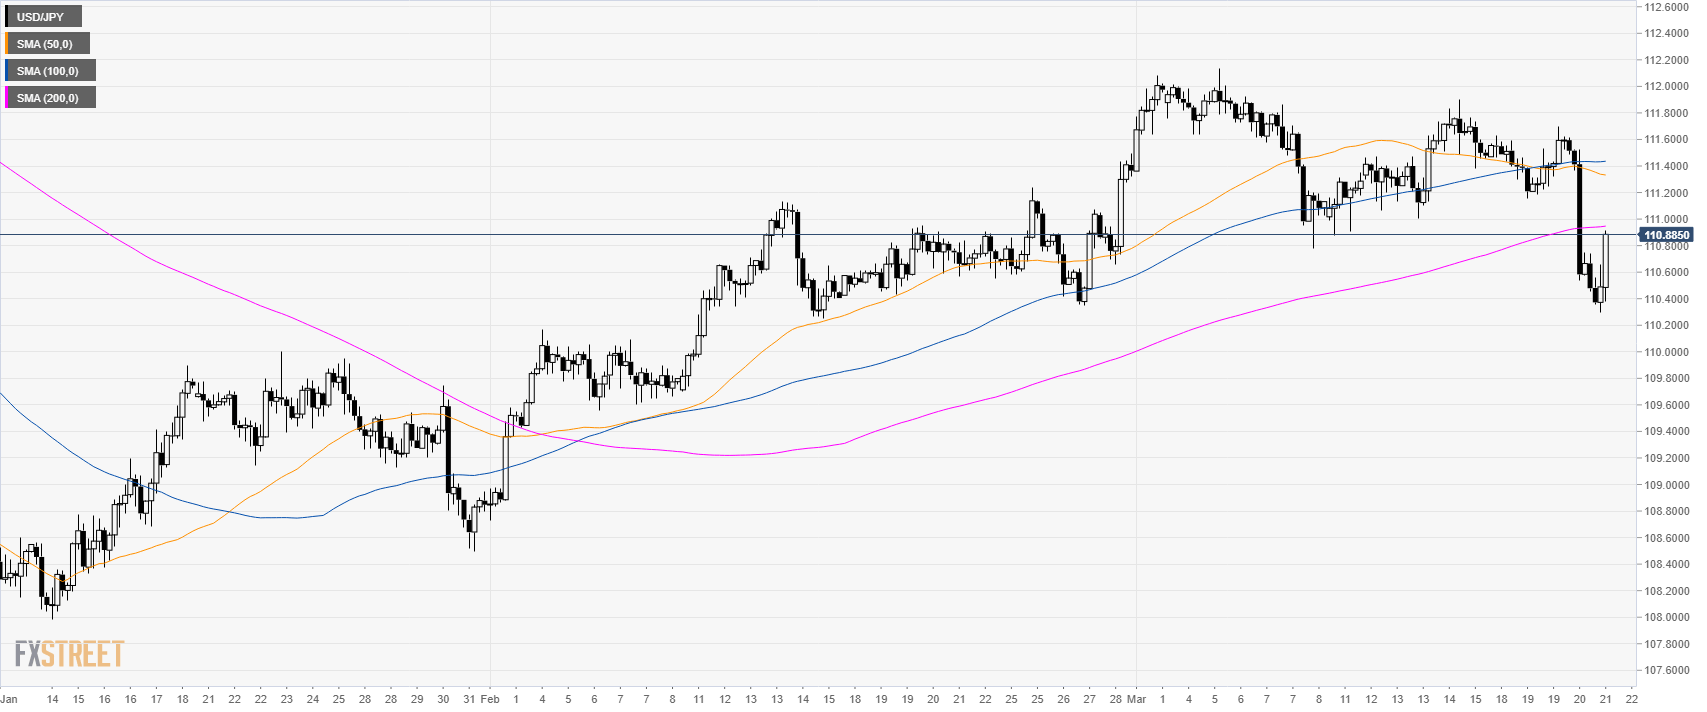
USD/JPY 4-hour chart
- USD/JPY is trading below its main SMAs suggesting bearish momentum in the medium-term.
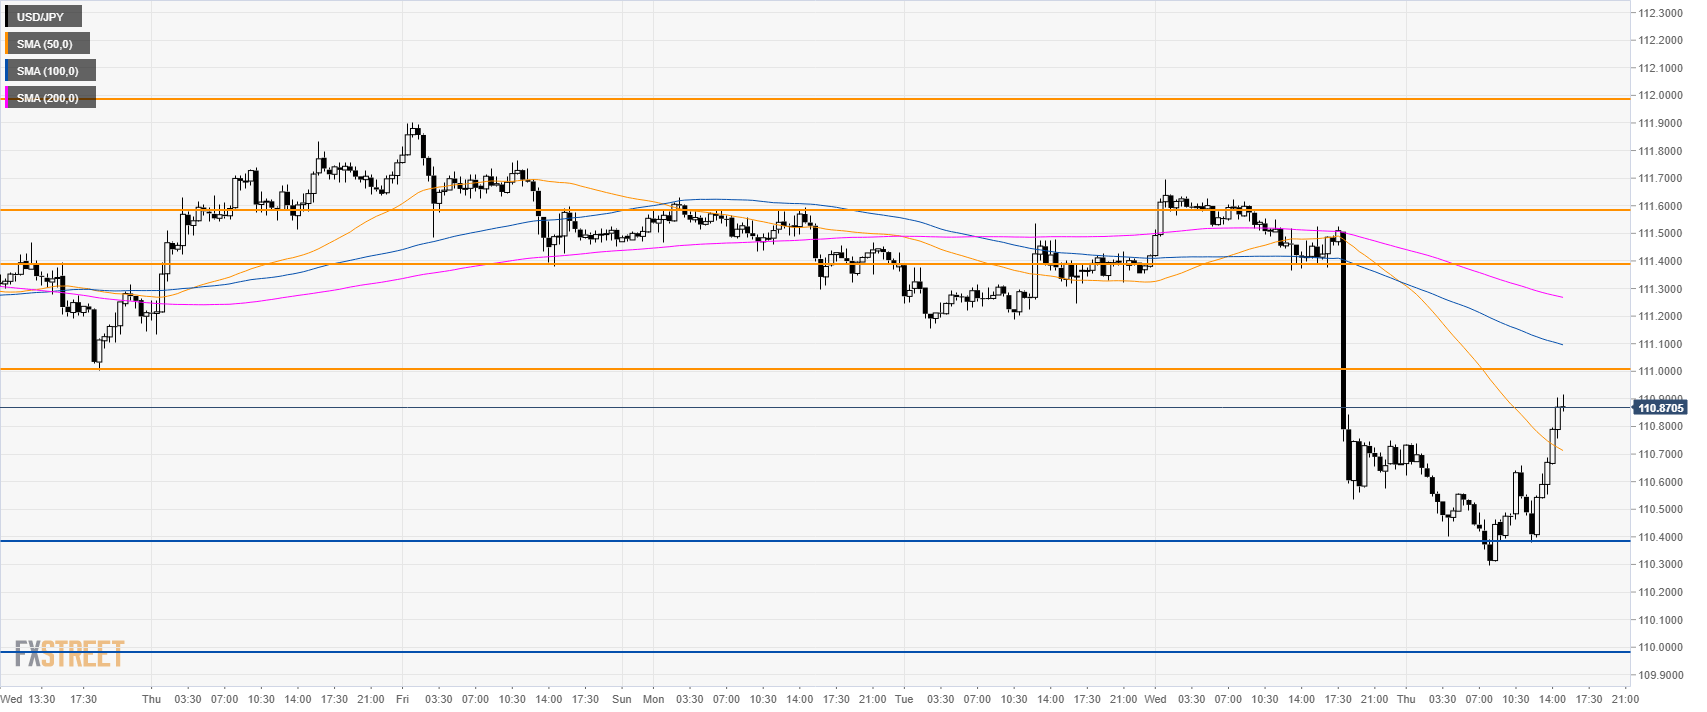
USD/JPY 30-minute chart
- USD/JPY is trading between its 50 and 100 SMAs suggesting a consolidation phase in the short-term.
- If the 111.00 resistance gets broken to the upside bull can take over and drive the markets towards 111.40, 111.60 and 112.00 handle.
- Support is at 110.40 and 110.00 figure.
Additional key levels