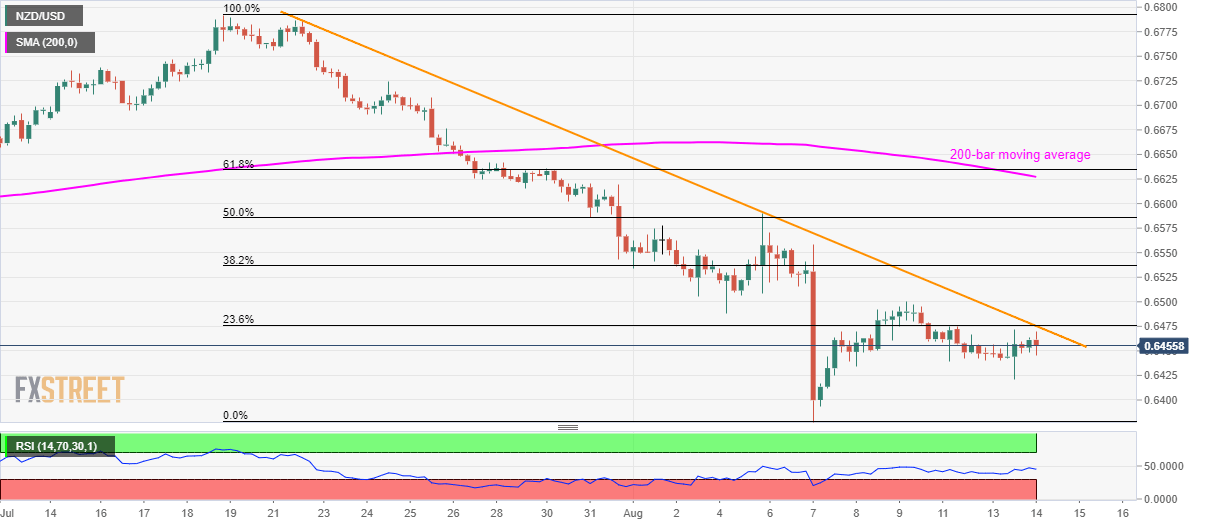
NZD/USD technical analysis: Buyers step back from 0.6475/76 confluence after China data
- China’s July month activity data disappoint Kiwi buyers.
- The NZD/USD pair takes a U-turn from 23.6% Fibonacci retracement and three-week-old resistance-line.
With China’s Industrial Production and Retail Sales lagging behind market consensus, NZD/USD witnesses pullback form near-term key resistance confluence as it trades near 0.6456 on early Wednesday.
China’s July month Industrial Production came in at 4.8% versus 5.8% expected while Retail Sales growth weakened to 7.6% against 8.6% forecast.
The pair now aims to revisit 0.6400 round-figure with 0.6425 being an intermediate halt. However, pair’s further declines will be limited to the monthly low of 0.6377, if not then 0.6350/45, including 2016 low, could grab sellers’ attention.
On the upside, a sustained break of 0.6475/76 enables the pair to aim for 0.6500 and monthly top surrounding 0.6590.
In a case buyers manage to dominate past-06590, 200-bar moving average at 0.6627 will be on their radar.
NZD/USD 4-hour chart

Trend: Bearish
