Back
21 Nov 2019
GBP/USD Technical Analysis: Cable drops near 1.2900 handle on USD strength
- The cable is rolling into the Asian session near its daily lows just above the 1.2900 figure.
- The level to beat for bears is the 1.2898 support.
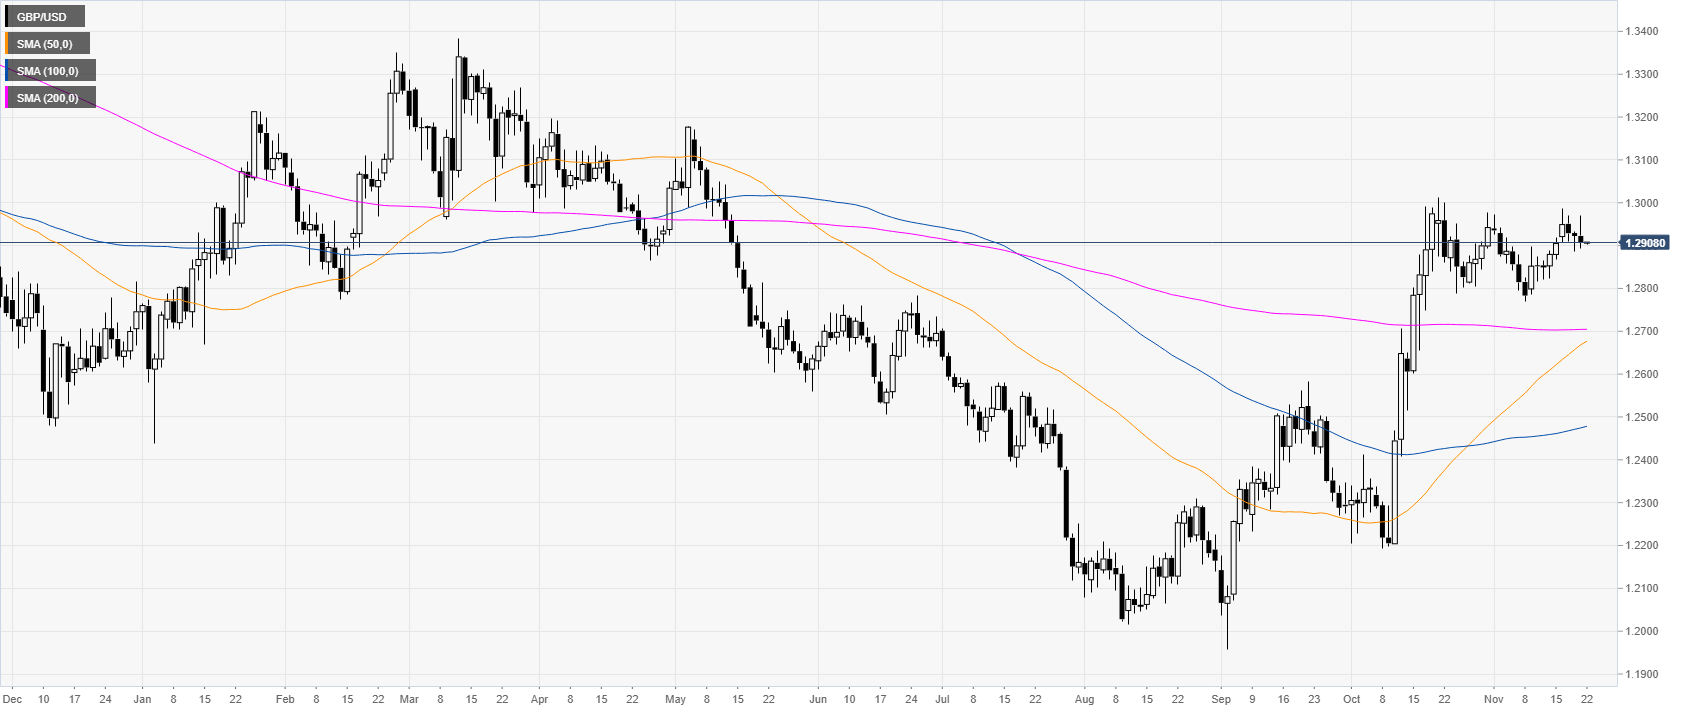
GBP/USD daily chart
Sterling/Dollar is easing from the November highs moving away from the 1.3000 handle while trading above its main daily simple moving averages (DMAs).
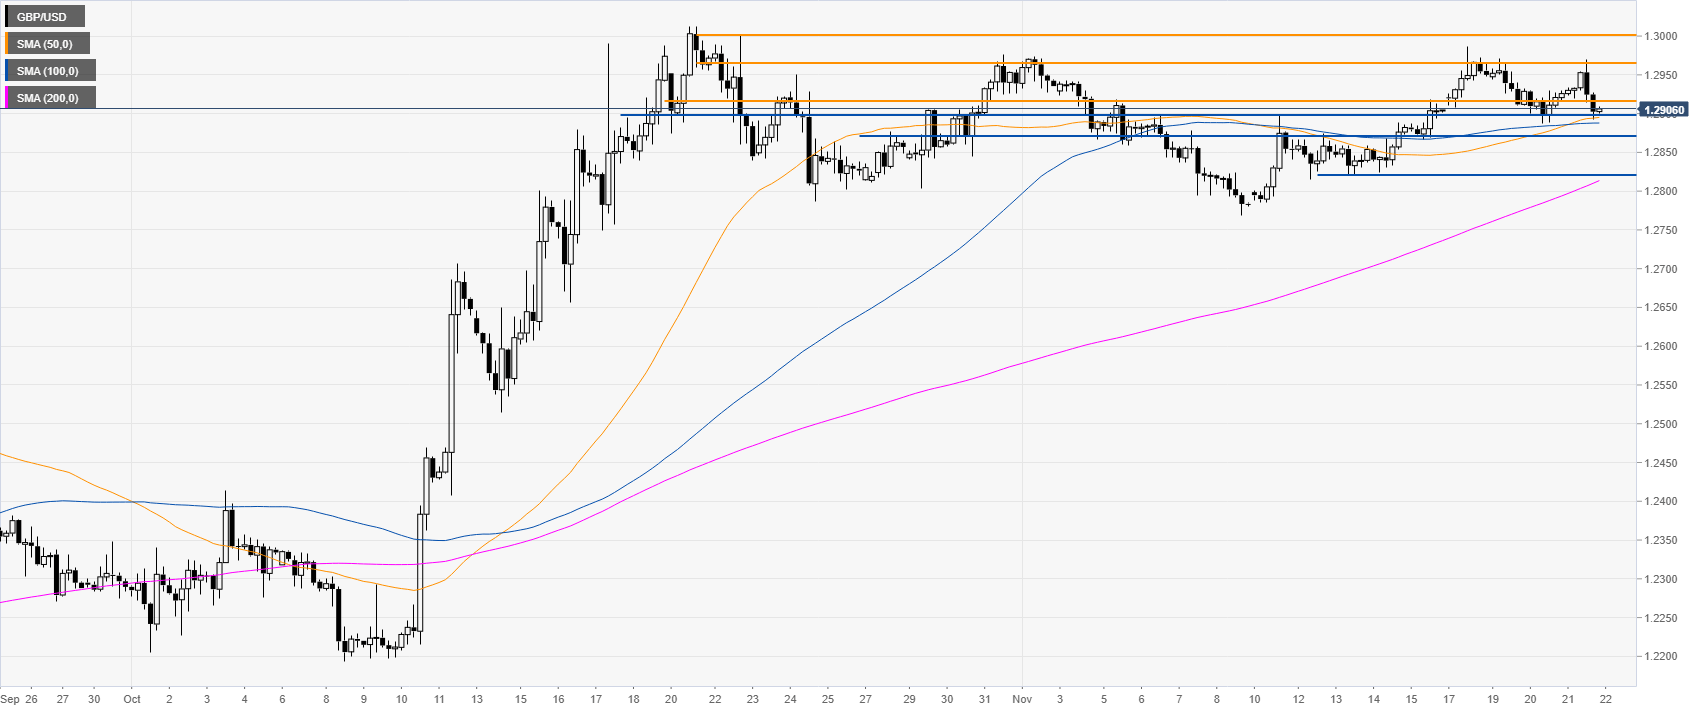
GBP/USD four-hour chart
The market is challenging the 1.2898 support while trading above its main SMAs. However, after rejecting three times the November highs, the market might start to decline below the 1.2898 support. The bear move can extend to the 1.2871 and 1.2820 levels, according to the Technical Confluences Indicator.
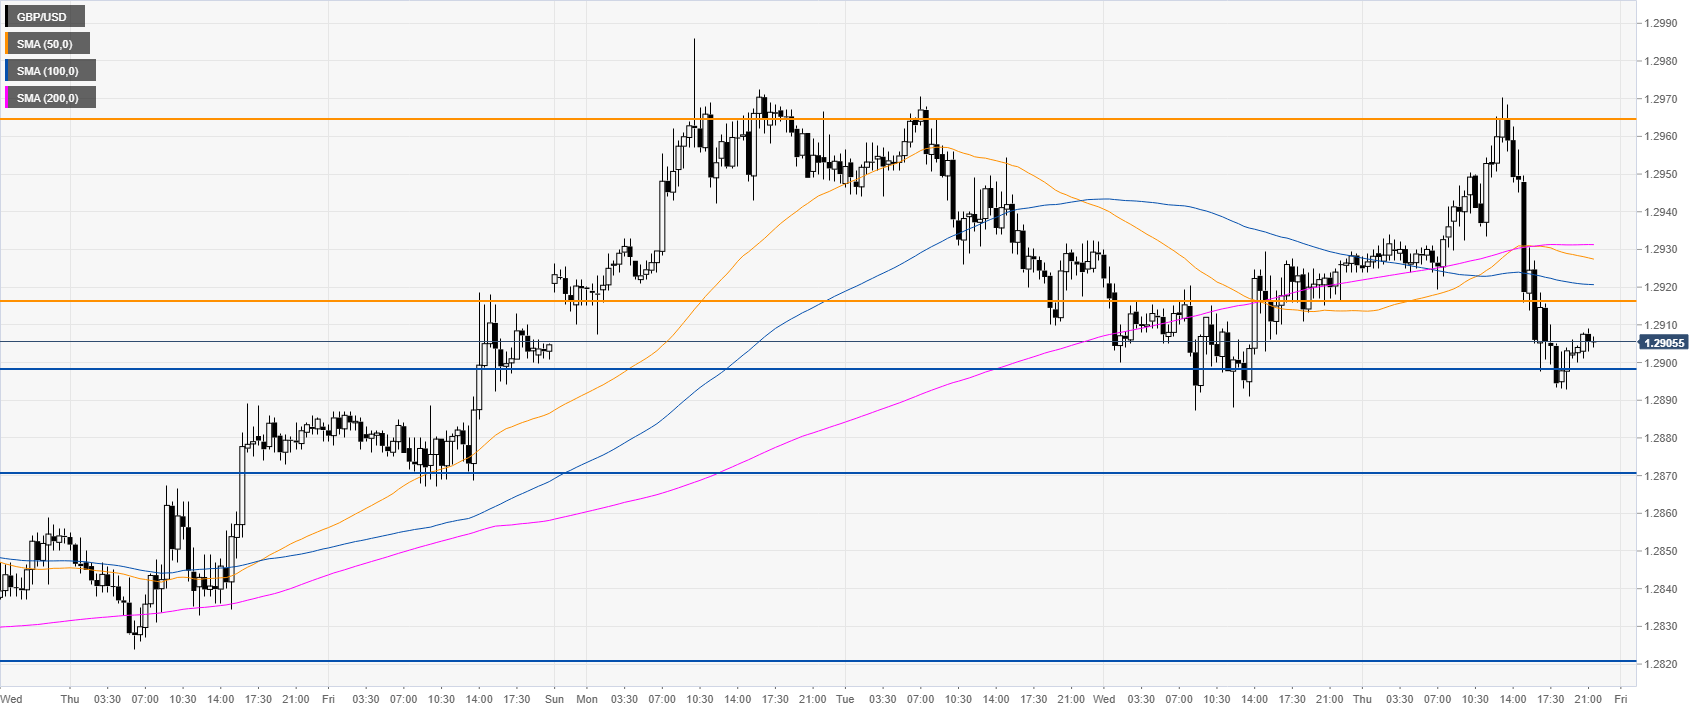
GBP/USD 30-minute chart
The market is trading just above the main SMAs, suggesting a bearish bias in the near term. Resistance is seen at the 1.2918, 1.2965 and 1.3000 price levels.
Additional key levels