Back
9 Dec 2019
USD/IDR Technical Analysis: Three-month-old support trendline in focus
- USD/IDR fails to cross multiple lows marked in November.
- 10-DMA acts as an additional upside barrier.
- Lows marked in November and September months can entertain bears during the breakdown.
USD/IDR declines to 14,015 during the pre-European session on Monday. The pair fails to hold on to gains registered on late-Friday, which in turn shifts sellers’ focus on the multi-month-old rising support line.
If prices stay sluggish below 14,000 support line, the November and September month bottoms around 13,965 and 13,910 will be the key to watch ahead of yearly low nearing 13,895.
Meanwhile, multiple lows marked in November around 14,030/35 limit the pair’s immediate upside prior to 10-Day Simple Moving Average (DMA) near 14,078.
In a case where the quote stays above 10-DMA, the monthly top near to 14,130 will be on the Bull’s radar.
USD/IDR daily chart
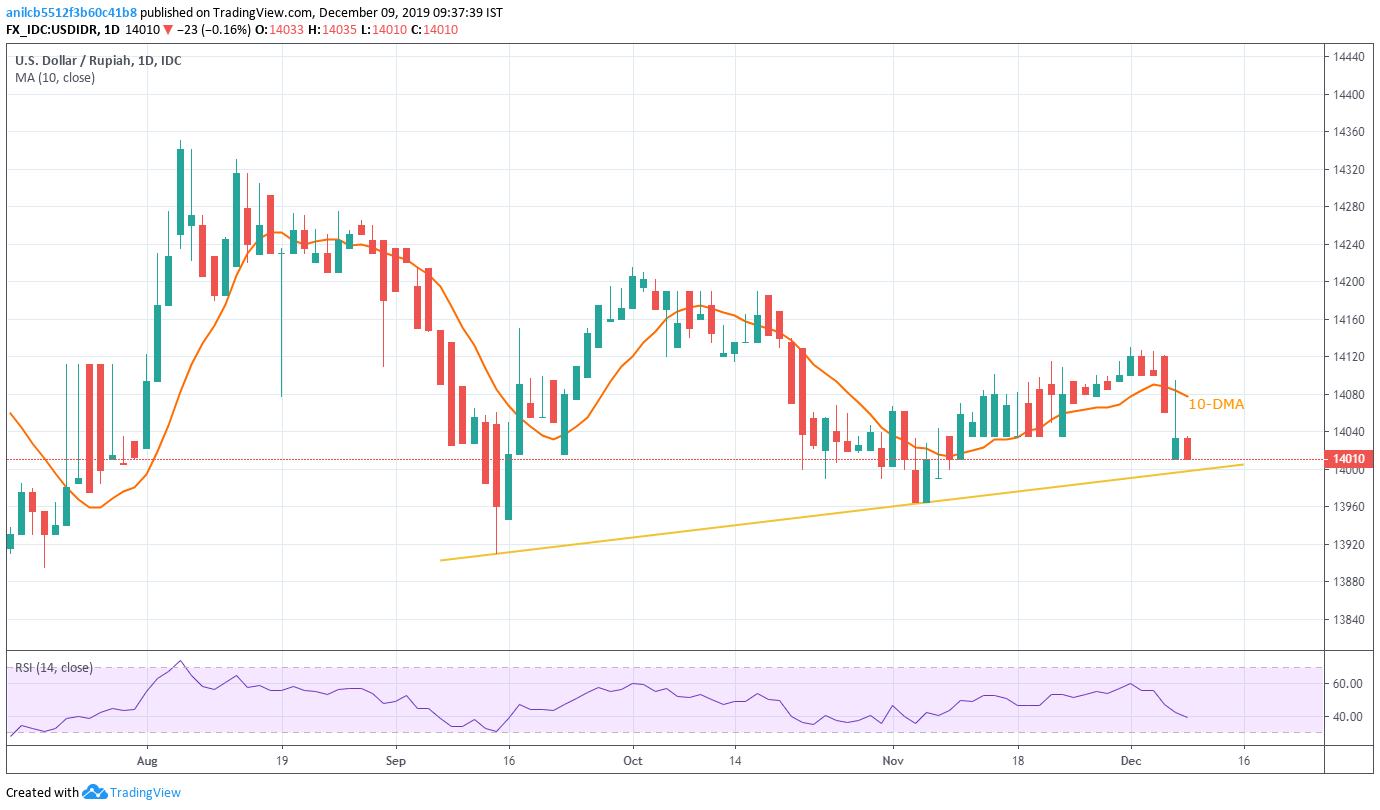
Trend: Bearish