Back
27 Apr 2020
S&P 500 Price Analysis: US stocks start the week bullish, heading towards 2900 figure
- S&P 500 index rebound from 2020 lows remains intact.
- The level to beat for buyers is the 2900 resistance.
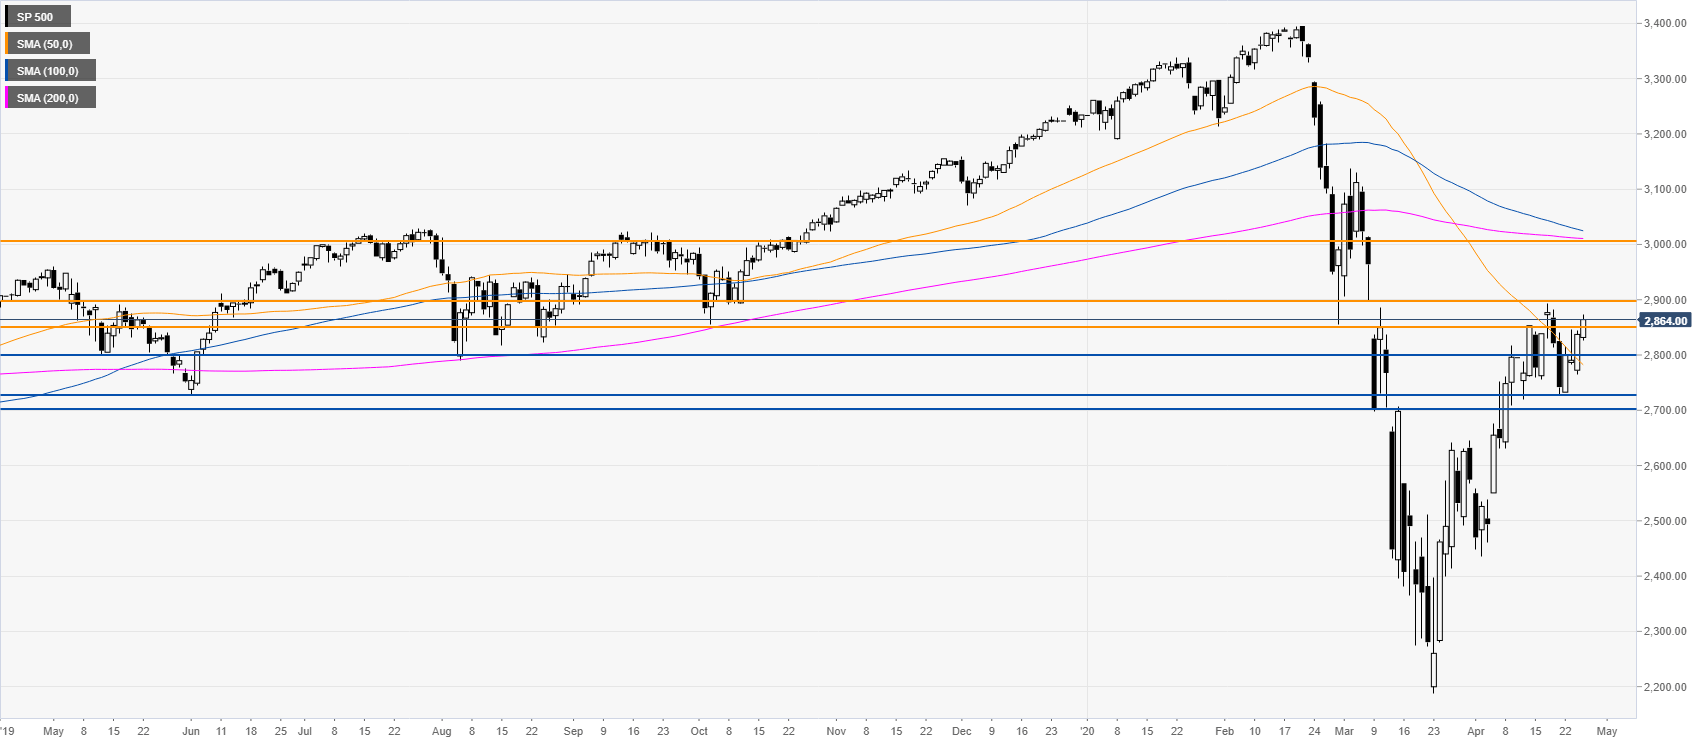
S&P 500 daily chart
The S&P 500 is starting the week with a modest advance above the 2850 resistance while holding above the 50 SMA on the daily chart. A daily close above the mentioned level should attract further buying interest and lif the market towards the 2900 swing high and potentially to the big round number, 3000. On the flip side, support could emerge near 2850, turning support and 2800 figure.
Additional key levels