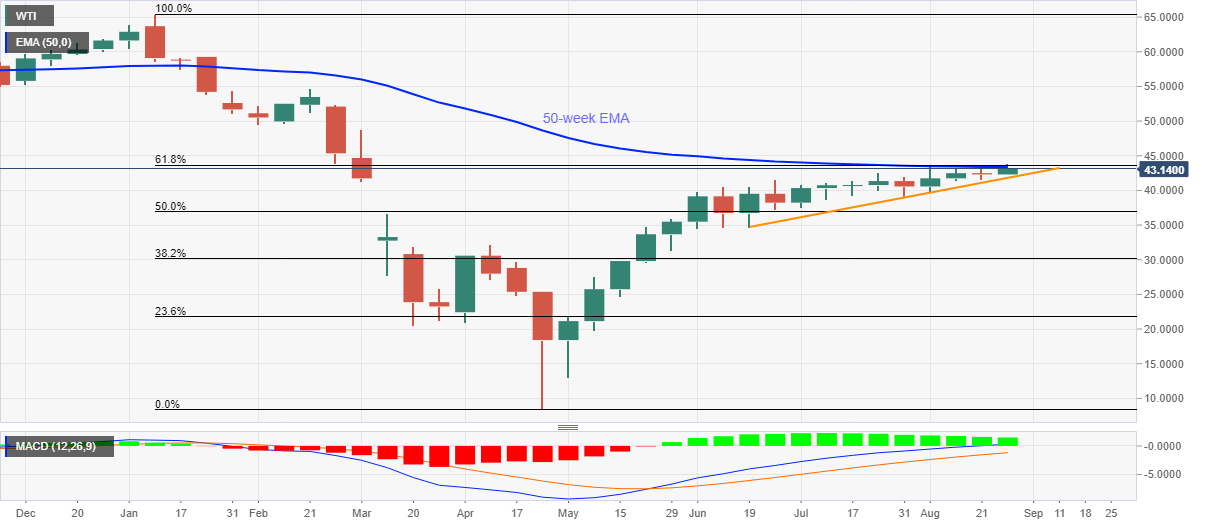
WTI Price Analysis: Prints a month of battle below 50-week SMA, 61.8% Fibonacci retracement
- WTI stays below a confluence of key SMA, Fibonacci retracement for fourth week in a row.
- Bullish MACD, sustained trading beyond an ascending trend line from June 19 favor the buyers.
- 50% Fibonacci retracement adds to the downside support.
WTI seesaws around $43.10 before the European traders gather for Friday’s bell. The black gold surged to the highest since early-March on Wednesday. However, a confluence of the 50-week SMA and 61.8% Fibonacci retracement level of the January-March fall restricts the quote’s upside afterward.
Even so, bullish MACD and repeated bounces off a multi-day-old support line raise bars for the sellers’ entry,
As a result, the energy benchmark is likely to remain dismal unless breaking the area between $41.80 and $43.60, comprising the key EMA and the mentioned support line respectively.
It should be noted that February month low near $44.00 adds to the upside barrier before driving it north to March month’s top around $48.75.
On the contrary, a downside break of $41.80 can take an intermediate halt near the $40.00 threshold before challenging a 50% Fibonacci retracement level of $36.88.
WTI weekly chart

Trend: Bullish
