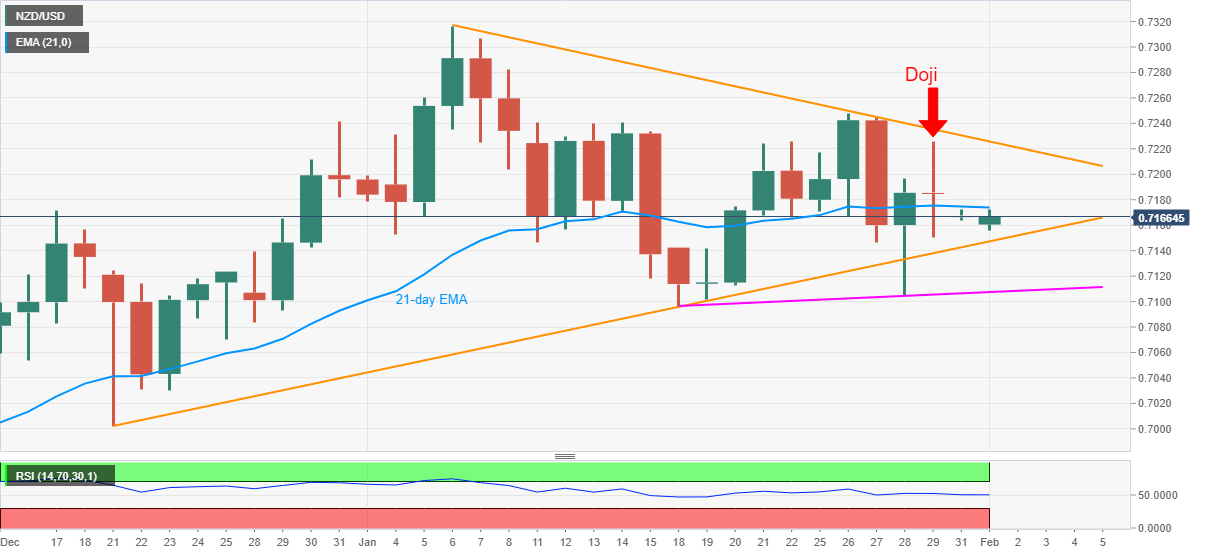
NZD/USD Price Analysis: Eases from 21-day EMA to stay below 0.7200
- NZD/USD remains depressed after the week-start gap-down.
- Ascending trend lines from December 21 and January 18 probe sellers.
- Friday’s Doji, monthly resistance line challenges the upside momentum beyond 21-day SMA.
NZD/USD struggles to fill the week-start gap below 0.7184 while taking rounds to 0.7170, down 0.22% intraday, during the early Asian trading on Monday. In doing so, the kiwi pair steps back from 21-day EMA while also respecting Friday’s Doji candlestick formation suggesting a reversal of Thursday’s corrective pullback.
However, an upward sloping trend line from December 21, followed by a two-week-long support line, respectively around 0.7145 and 0.7105, not to forget the 0.7100 threshold, currently tests the NZD/USD sellers.
While risk aversion favors the NZD/USD bears, any further weakness past-0.7100 will not hesitate to challenge the late December low near the 0.7000 psychological magnet.
On the upside, a clear break above 21-day EMA, at 0.7175 now, needs to cross Friday’s high and a downward sloping resistance line from January 06, currently around 0.7225, to convince NZD/USD buyers.
Following that, the 0.7300 round-figure and January’s top of 0.7316 will be in the spotlight.
To sum up, NZD/USD traders may witness short-term downside but the broad trend remains in favor of the bulls.
NZD/USD daily chart
Trend: Pullback expected