WTI bulls eye the M-formation's neckline and resistance of confluence
- WTI was under pressure but there is a compelling case for a deeper test of resistance.
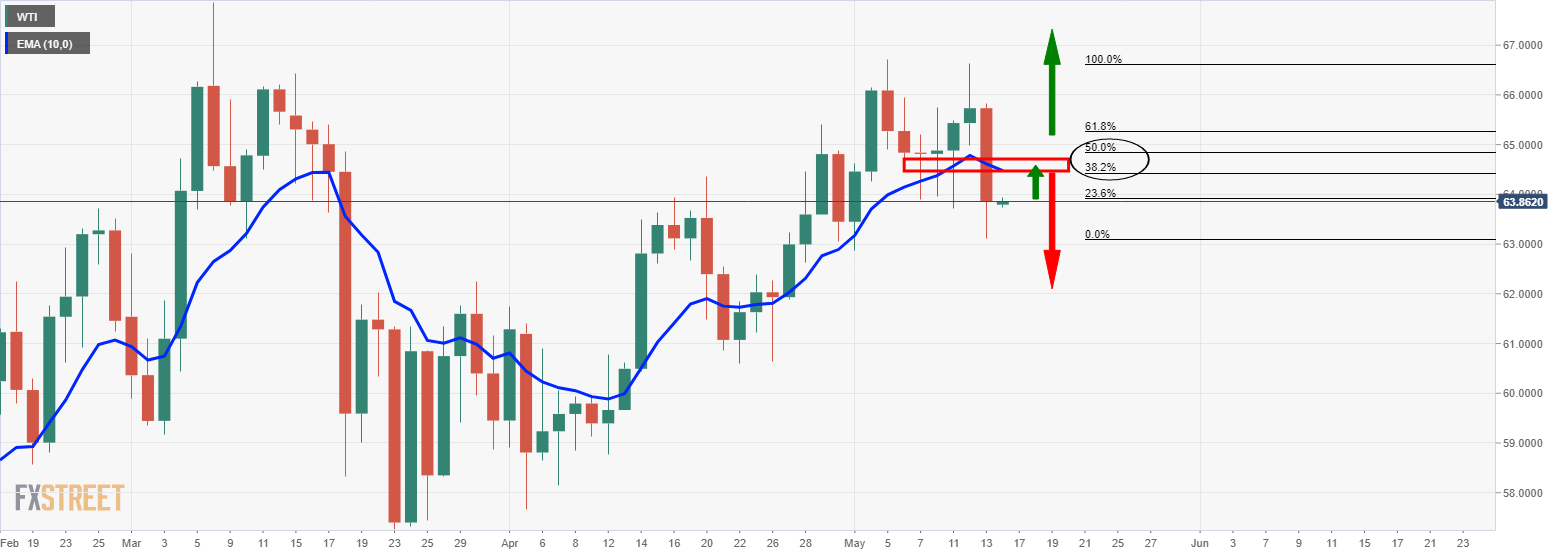
- The bulls will seek a break of the 10-day ema and confluence of resistance.
West Texas Intermediate trading at $63.84 and flat on the day so far as traders take into account India's coronavirus crisis which helped to shave around 3% off the price of crude oil on Thursday.
Meanwhile, WTI futures settled $2.26, or 3.4%, lower at $63.82 a barrel, having risen 1.2% in the previous session and the spot fell from $65.79 to a low of $63.12.
Brent crude also ended the session down $2.27, or 3.3%, at $67.05 a barrel, after rising 1% on Wednesday.
These moves have resulted in the biggest daily drops in percentage terms since early April.
The variant of the coronavirus has swept through India, the world's third-biggest importer of crude at a time when the US dollar has turned bid again.
''India's infection curve is also pointing to nascent signs of flattening, which could ease demand fears and help boost sentiment in the energy complex,'' analysts at TD Securities explained.
''In this context, while OPEC+ may continue to unwind their extraordinary supply curtailments, a continued cautious approach could still see prices overshoot for a period of time. However, the massive scale of OPEC's spare capacity suggests that a break north of $70/bbl is not sustainable.''
As for the greenback, the labour shortage and much stronger-than-expected consumer prices data this week have fanned the flames of concerns for inflation.
Foreign oil traders fear that the Federal Reserve will raise interest rates fuelling a bid in the greenback which in turn makes oil less attractive as an investment.
WTI technical analysis
Technically, the price is correcting the daily bearish impulse on the 4-hour time frame albeit within bearish territory given the 10 and 20 EMA bearish crossover and negative MACD.
Sellers may emerge for the end of the week sessions below the 10-EMA to push the price below the prior daily closing lows of 64.48.
On the upside, the bulls will need to clear the daily resistance and neckline of the daily M-formation located at 64.84. In turn, the price will be above the 10-day EMA within bullish 4-hour conditions as well.
Daily chart