USD/INR Price News: Indian rupee grinds lower inside weekly triangle
- USD/INR seesaws inside a short-term symmetrical triangle, eases from intraday high of late.
- Firmer RSI, sustained trading beyond key SMAs favor bulls.
- Monthly ascending trend line adds to the downside filters.
USD/INR steps back from the day’s top to 74.26 while reversing early Asia gains amid the early Indian trading session on Tuesday. In doing so, the Indian rupee (INR) pair funnels down to the break-points of a one-week-old symmetrical triangle.
It should, however, be noted that strong RSI conditions join the cross-currency pair’s successful trading above the key SMAs, as well as a short-term support line, to keep USD/INR buyers hopeful.
Though, a clear upside break of 74.35 becomes necessary for the bull’s entry.
Following that, the monthly high around 74.50 and the mid-April lows near 74.55 will be tough resistances to crack for the pair buyers ahead of targeting the 75.00 threshold.
Meanwhile, 50-SMA adds strength to the stated triangle’s support near 74.20, a break of which can trigger the quote’s south-run towards an ascending support line from late May, around 73.75.
Even so, the 200-SMA level of 73.30 keeps the door open for USD/INR sellers’ return.
USD/INR four-hour chart
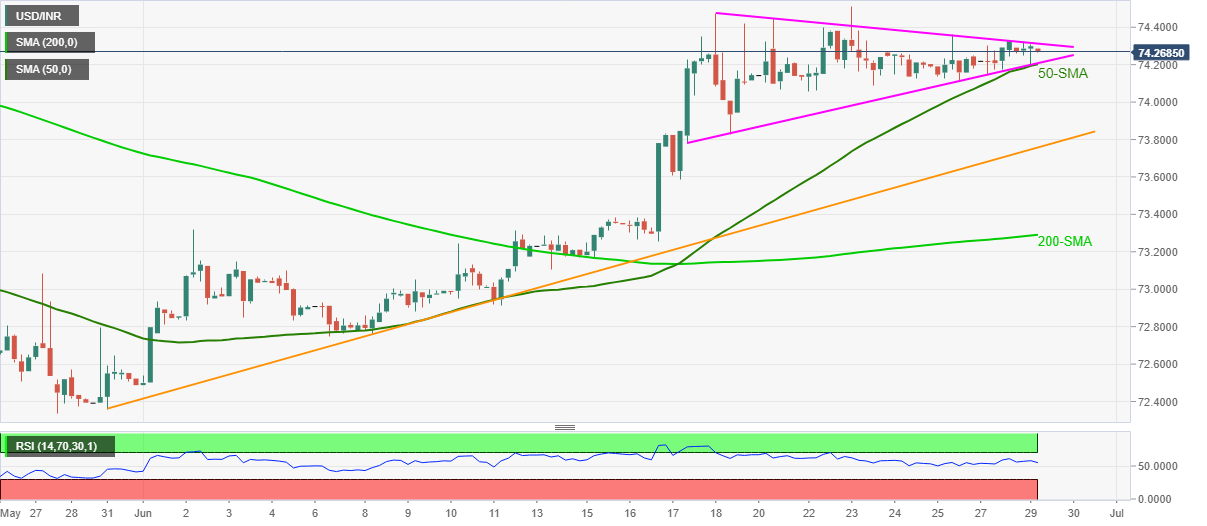
Trend: Bullish