Silver Price Analysis: XAG/USD trades with modest gains around $24.00 mark, 50% Fibo.
- Silver attracted dip-buying near the weekly trading range support, around the $23.80-75 region.
- The range-bound price action constitutes the formation of a rectangle, pointing to indecision.
- Mixed technical indicators on hourly/daily charts warrant caution before placing aggressive bets.
Silver regained some positive traction on the last day of the week and recovered a part of the previous day's losses. The commodity maintained its bid tone through the first half of the European session and was last seen hovering around the $24.00 mark.
Looking at the broader picture, the XAG/USD has been oscillating in a range since the beginning of this week. The price action constitutes the formation of a rectangle on short-term charts, pointing to indecision amid traders over the next leg of a directional move.
Meanwhile, technical indicators on hourly charts have again started gaining positive traction but are yet to confirm a bullish bias on the daily chart. This, in turn, makes it prudent to wait for a convincing break through the trading range before placing aggressive bets.
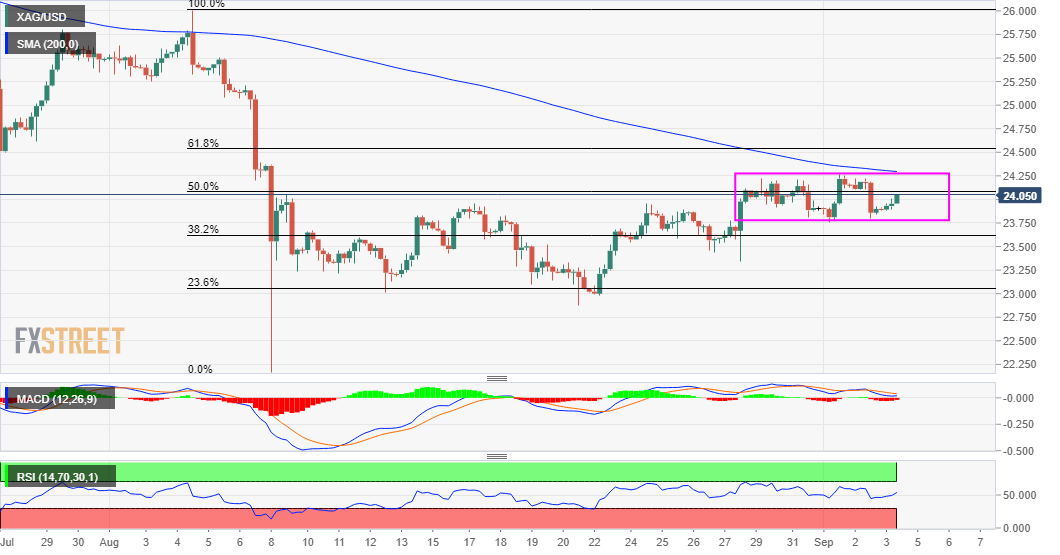
From current levels, any subsequent positive move might continue to confront stiff resistance near the $24.20-25 region. This is closely followed by the 200-period SMA and a resistance marked by the 61.8% Fibonacci level of the $26.00-$22.17 downfall, around the $24.50 area.
A sustained move beyond will be seen as a fresh trigger for bullish traders and pave the way for a further near-term appreciating move. The XAG/USD might then accelerate the momentum towards the key $25.00 psychological mark en-route the next hurdle near the $25.35-40 region.
On the downside, the lower boundary of the weekly trading range, around the $23.80-75 region, should continue to protect the immediate downside. Some follow-through selling below the 38.2% Fibo. level, around the $23.60 region, could drag the XAG/USD towards the $23.00 mark, or 23.6% Fibo.
Silver 4-hour chart
Technical levels to watch