EUR/USD Price Analysis: Bullish RSI divergence, falling wedge tease buyers below 1.0200
- EUR/USD picks up bids around multi-year low inside a bullish chart pattern.
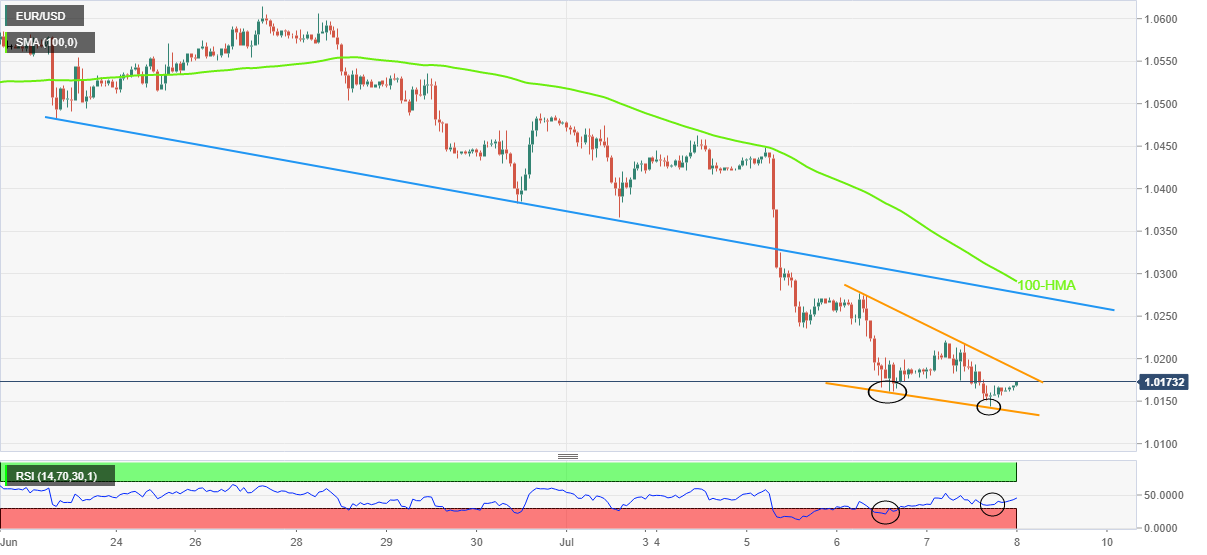
- Bullish RSI divergence adds strength to the upside bias.
- Two-week-old previous support, 100-HMA adds to the upside filters.
EUR/USD consolidates losses at the lowest levels since 2002, picking up bids to 1.0165 during Friday’s Asian session.
The major currency pair has been trading mostly sideways since Wednesday, which in turn portrays the falling wedge bullish chart pattern on the hourly play.
Also teasing the EUR/USD buyers is the bullish RSI divergence. The quote has recently been forming lower low on prices but the RSI (14) does portray higher lows and hence hint at the bullish build of momentum.
However, a clear upside break of the 1.0190 hurdle appears necessary to confirm the falling wedge.
Even so, a fortnight-long resistance line and the 100-HMA could challenge the pair’s further upside, respectively near 1.0280 and 1.0290.
Meanwhile, pullback moves could revisit the latest multi-year low of 1.0144 before the stated wedge’s support line, near 1.0135, could challenge the EUR/USD bears.
In a case where the EUR/USD prices remain pressured below 1.0135, the odds of witnessing the 1.0000 psychological magnet on the chart can’t be ruled out.
EUR/USD: Hourly chart
Trend: Further recovery expected